Every once in a while, I'll see a retweet of this image explaining the discrete Fourier transform (DFT) by Stuart Riffle:
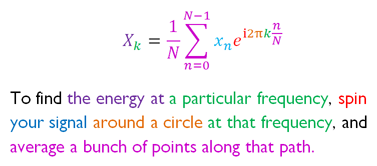
While a complete theoretical understanding this equation requires the some prerequisite knowledge to precisely decompose, it's visually apparent to observe how coloring the components might assist in learning this formula.
Over the years I've kept a list of interactive pieces that remix this idea towards sharing mathmetical insight, making use of web-oriented Javascript libraries like D3.js or P5.js to deconstruct concepts in a literate programming style: a mixture of code, visualization, and natural-language explanation.
In particular, this hybrid interative & literate model separates the technique from other resources where programmers share smaller vignettes of solutions (like bl.ocks or Shadertoy). The interactivity of the sketches adds a dimension of learnability that speaks to people who like to approach new concepts with an abundance of variable-tweaking and knob-fiddling.
Bret Victor, Vi Hart, and Ken Perlin have been strong champions of this model with articles like Up and Down the Ladder of Abstraction, Learnable Programming, The Parable of the Polygon, and interactive platforms like Chalk Talk.
What follows are some of my favorite visual math explorations, many of which are relevant to beginners in 3D graphics or game engine development. For a longer and more comprehensive treatise on this idea, a 2020 article by Fred Hohman et al on Communicating with Interactive Articles provides a deeper look into the theory and practice of their construction.
| Handy Math |
|---|
| A variety of helpful 2D visualizations of common linear algebra concepts like projection, the dot product, and cross product. |
| Immersive Math |
|---|
| A visual, interactive but more traditional introduction of core linear algebra concepts including other topics not covered in Handy Math including matrices and eigenvalues/eigenvectors. |
| Lights and Shadows |
|---|
| A beautiful illustrative guide on understanding the nature of light and the constituent math that graphics programmers use to model simulations of it. |
| Seeing Circles, Sines, and Signals |
|---|
| A particularly accessible introduction to digital signal processing. This covers everything from sampling theory to higher-level concepts like the Fast Fourier Transform. |
| Hexagonal Grids and Introduction to A* Pathfinding |
|---|
| RedBlobGames (aka Amit Patel) has an impressive collection of interactive posts spanning years of work, however two in particular — on hexagonal grids and A* pathfinding — are essential learning material on these topics. |
| 2D Metaballs |
|---|
| Isosurfaces are found in many corners of graphics and computer vision. This is a short visual tutorial implementing a minimal 2D version of an isosurface: cute blobby shapes called metaballs. |
| A Primer on Bézier Curves |
|---|
| Universal fixtures in any 2D or 3D engine, splines are commonly employed for camera animation, object trajectory planning, and more. This covers the mathematical basis of Bézier splines and useful comparisons with other spline representations (like Catmull-Rom & B-Splines) |
| How to Fold a Julia Fractal |
|---|
| Steve Wittens (aka Acko) has numerous interactive, exploratory posts using his custom WebGL Mathbox framework. Steve's post on Julia fractals is particularly excellent. (Thanks @meshula for this link). |
As a final thought, it would be interesting to see a common web platform for sharing these kinds of visual/interactive explanations. The machine learning community leans heavily on Jupyter notebooks. An ideal combination might be some remix of features across Codepen, Jupyter, and Shadertoy.
All images copyright their respective owners.
Comment -